
Understand the big picture
 | |||
| Follow us... | |||
 |  | ||
| Published: | 2012-May-09 |
| Last Updated: | 2012-May-09 |
| Principal Writer: | Barry Shatzman |
 | Understanding The Issue |
| Analysis and Perspectives |
| What You Can Do |
 | More Information |
| The Rumor Mill |
American Taxpayer Relief Act
2012 (HR-8)
Tax Relief, Unemployment Insurance2010 (HR-4853)
Jobs and Growth Tax Relief2003 (HR-2)
Economic Growth and Tax Relief2001 (HR-1836)
We gotta ask...
DID YOU JUST LEARN SOMETHING?
Is it worth a dollar?
News in FiVe is free to read, but it takes time and money to publish.
If you find what we do valuable, please help us continue with a small donation.
Even a dollar or three every so often makes a difference.
It's secure and takes only about a minute.
Thanks!
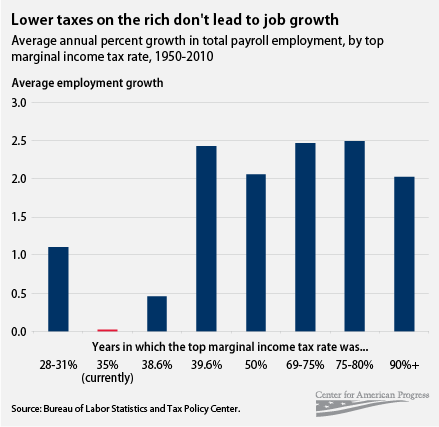
Another view on the effect of taxes on creating jobs
This chart uses the same data as the one we presented in the Background section. But, rather than presenting the data by year, it shows the average unemployment growth in a year based on the marginal tax rate in effect for that year.
 .
.
It shows that in years in which the marginal tax rates were the highest, the most job growth took place. Click on the chart to read the full story by the Center for American Progress.
Pictures of Wealth
These charts from MotherJones.com show in various ways how money has moved from virtually all Americans into the hands of the top 1 percent.
Where do we get our data?
In the chart comparing yearly marginal tax rates to unemployment rates, the tax rate data came from the U.S. Internal Revenue Service. The unemployment rate data came from the U.S. Bureau of Labor Statistics
You can download a copy of the September 2012 Congressional Research Service report by clicking here
Click here to continue to the next section of this issue...